ELK Stack for Centralized Log & Identity Monitoring
A complete end‑to‑end setup: collect Nginx, system & AD logs, visualize in Kibana, and alert on failed logins.
What It Does
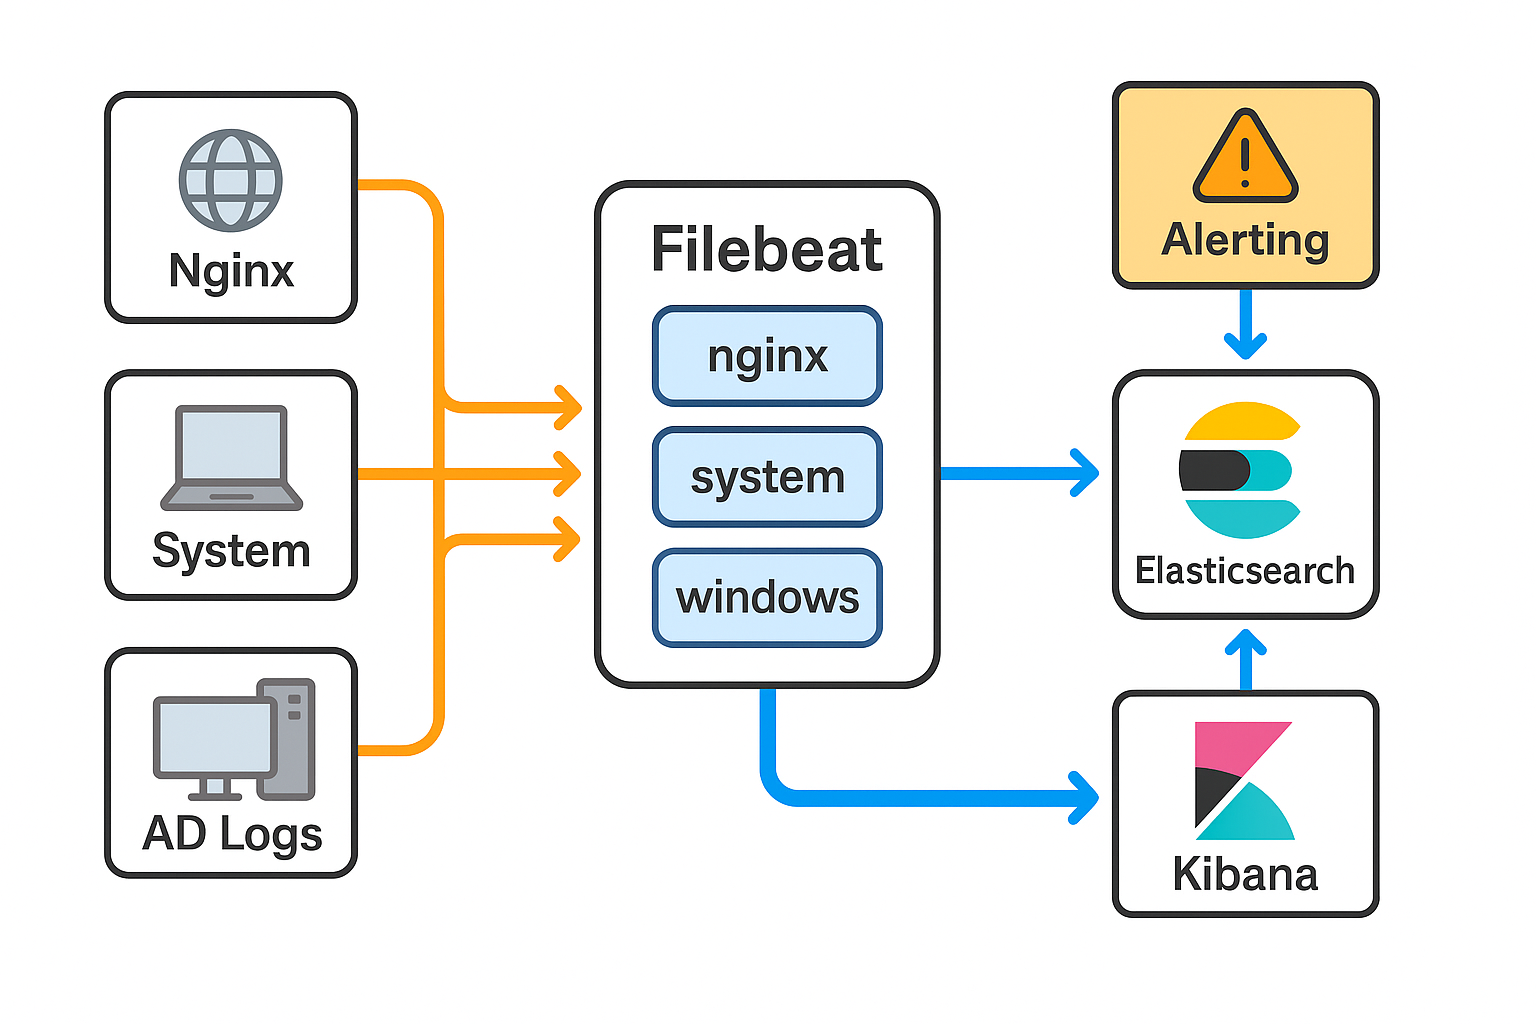
By installing Elasticsearch, Filebeat and Kibana on your server, this solution:
- Collects logs from Nginx web‑access, system events (e.g.
auth.log) and Windows AD - Parses successful & failed login events via Filebeat modules
- Indexes everything in Elasticsearch for lightning‑fast search
- Visualizes real‑time dashboards in Kibana
- Sends alerts on suspicious activity (e.g. repeated failed logins)
Mapped to Core Competencies
Monitoring
Precise traffic analytics and security metrics, all in one dashboard.
Identity & Access
Real‑time audit of user logins, access changes, and failed authentication alerts.
Architecture Overview
Installation Steps
-
Install Java 11
sudo apt update && sudo apt upgrade -y sudo apt install openjdk-11-jdk -y -
Configure Elastic APT Repo
wget -qO - https://artifacts.elastic.co/GPG-KEY-elasticsearch | sudo apt-key add - sudo apt install apt-transport-https -y echo "deb https://artifacts.elastic.co/packages/7.x/apt stable main" \ | sudo tee /etc/apt/sources.list.d/elastic-7.x.list sudo apt update -
Elasticsearch Installation
sudo apt install elasticsearch -y # In /etc/elasticsearch/jvm.options set -Xms350m and -Xmx350m sudo systemctl enable elasticsearch sudo systemctl start elasticsearch -
Filebeat & Modules
sudo apt install filebeat -y sudo filebeat modules enable nginx system # Optional: sudo filebeat modules enable windows sudo filebeat setup --index-management --pipelines --modules nginx system sudo filebeat setup --dashboards -
Filebeat Output Configuration
# In /etc/filebeat/filebeat.yml output.elasticsearch: hosts: ["localhost:9200"] setup.kibana: host: "localhost:5601" sudo systemctl enable filebeat sudo systemctl restart filebeat -
Kibana Setup
sudo apt install kibana -y
# In /etc/kibana/kibana.yml set server.host: "0.0.0.0"
sudo systemctl enable kibana
sudo systemctl start kibana
sudo ufw allow 5601/tcp
Verification in Kibana
- Create an index pattern
filebeat-*and select@timestamp. - In Discover, filter by
event.datasetortags: "failed_login". - Explore the pre‑built dashboards under Dashboard → All dashboards.
Public Traffic Overview
This live summary (updated daily) shows non‑sensitive Nginx metrics: